Difference between revisions of "Functional Analysis Talk"
(Created page with "= Why do functional analysis? = * Statistical significance is not the same as biological significance * Variety of methods available to compare functional annotation to gene...") |
|||
| Line 16: | Line 16: | ||
* GOrilla | * GOrilla | ||
| − | = | + | = A functional analysis method = |
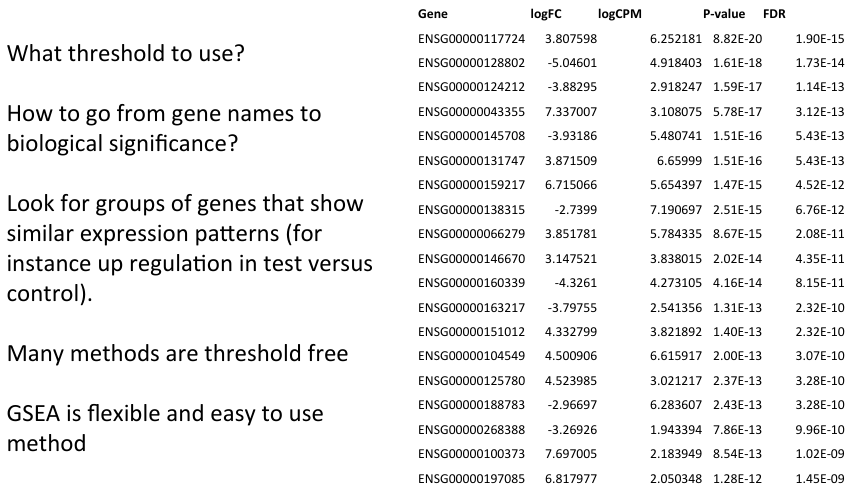
[[File:fourcol.png]] | [[File:fourcol.png]] | ||
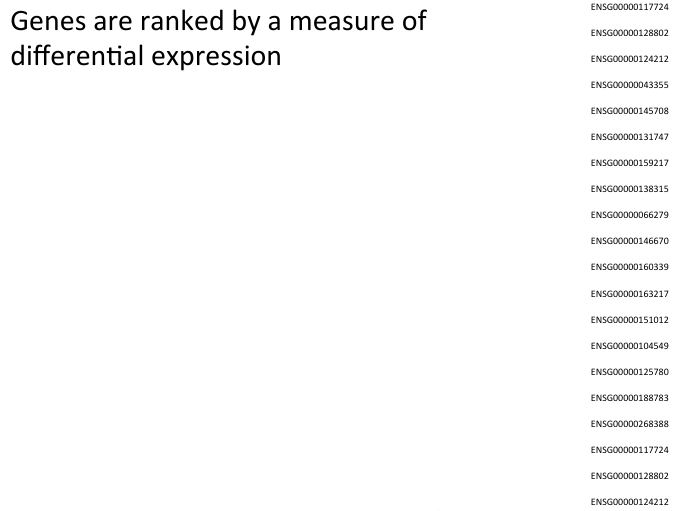
| − | = | + | = First order by measure of DE = |
[[File:rankintro.png]] | [[File:rankintro.png]] | ||
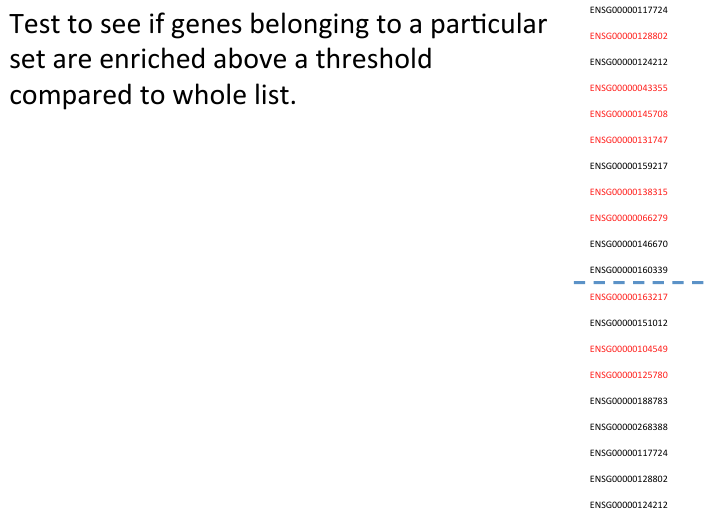
| − | = | + | = Compare to list = |
[[File:line1.png]] | [[File:line1.png]] | ||
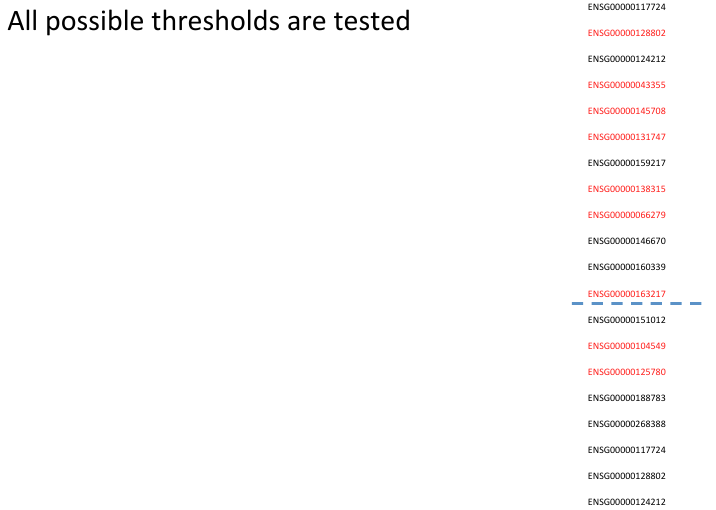
| − | = | + | = Move through each gene 1 = |
[[File:line2.png]] | [[File:line2.png]] | ||
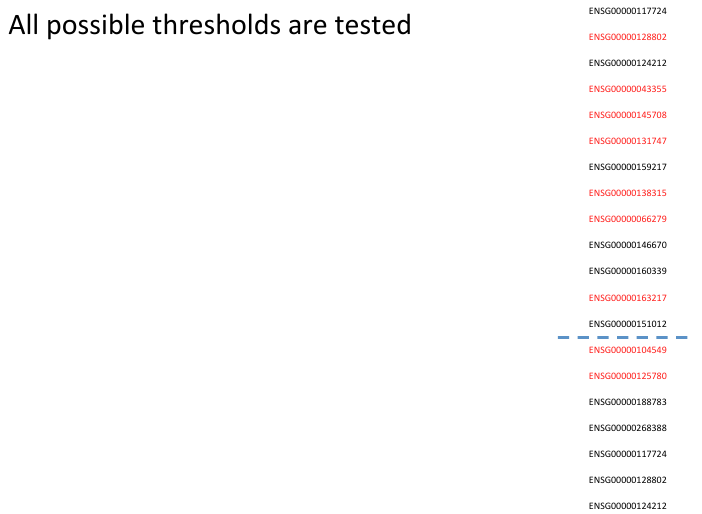
| − | = | + | = Move through each gene 2 = |
[[File:line3.png]] | [[File:line3.png]] | ||
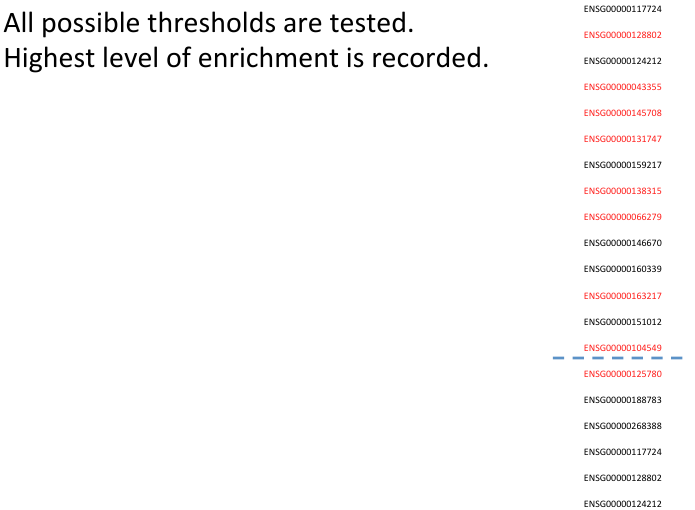
| − | = | + | = Highest Level identified = |
[[File:highen.png]] | [[File:highen.png]] | ||
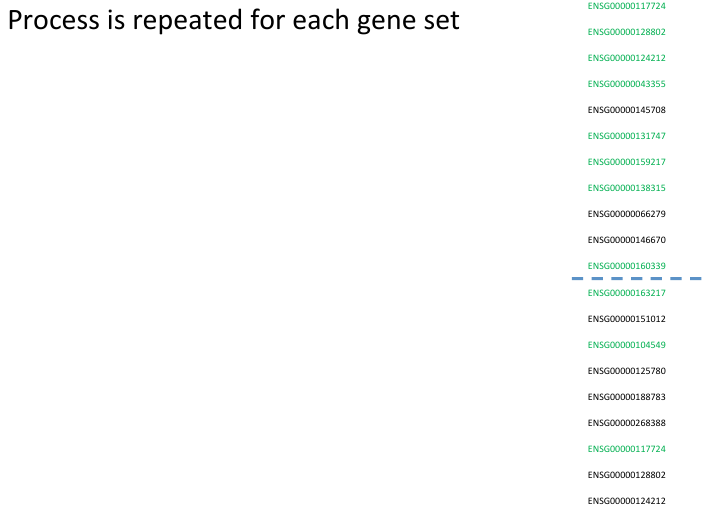
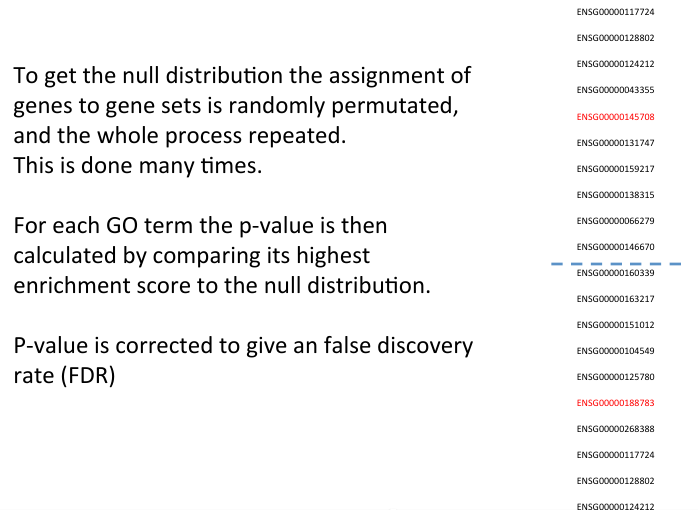
| − | = | + | = Repetition of Process = |
[[File:eachgs.png]] | [[File:eachgs.png]] | ||
Revision as of 23:32, 11 May 2017
Contents
- 1 Why do functional analysis?
- 2 Functional analysis methods
- 3 A functional analysis method
- 4 First order by measure of DE
- 5 Compare to list
- 6 Move through each gene 1
- 7 Move through each gene 2
- 8 Highest Level identified
- 9 Repetition of Process
- 10 Gene Set Enrichment Analysis
- 11 Gene Set Enrichment Analysis
- 12 Conclusions
- 13 Further reading
Why do functional analysis?
- Statistical significance is not the same as biological significance
- Variety of methods available to compare functional annotation to gene data
- General aim is to identify gene functions/categories that show an interesting expression profile
- Potentially identify genes with smaller but biologically significant changes.
Functional analysis methods
- Positional Gene Enrichment – looks for regions of chromosome showing changed expression.
- The Ingenuity Pathways Analysis (IPA)
- Several methods use Gene Ontology (GO) terms or other "gene sets"
- GO is the means by which we identify function.
- Gene Set Enrichment Analysis (GSEA)
- GOAL: Gene Ontology AnaLyzer
- GOrilla
A functional analysis method
First order by measure of DE
Compare to list
Move through each gene 1
Move through each gene 2
Highest Level identified
Repetition of Process
Gene Set Enrichment Analysis
Gene Set Enrichment Analysis
[[File::gseawind.png]] Example GSEA report of a gene set found to be enriched among down regulated genes in cancer samples
Conclusions
- A wide variety of methods are available for functional analysis of expression data
- Aids biological interpretation of the data
- Different types of annotation can be compared to expression data.
- Many methods do not require user specified thresholds
Further reading
- Eden et al "GOrilla: a tool for discovery and visualization of enriched GO terms in ranked gene" BMC Bioinformatics 2009
- Volinia et al "GOAL: a software tool for assessing biological significance of genes groups" Nucleic Acids Res 2004
- Tamayo, et al."Gene set enrichment analysis: A knowledge-based approach for interpreting genome-wide expression profiles" PNAS 2005
- Preter et al "Positional gene enrichment analysis of gene sets for high-resolution of overrepresented chromosomal regions" Nucleic Acid Research 2008
- http://www.ingenuity.com/products/ipa
