Difference between revisions of "Quality and Control Preprocessing Talk"
(Created page with "Quality control and data pre-processing = Contents = * Data formats : – Fasta and Fastq formats : – Sequence quality encoding * Quality Control (QC) :– Evaluation of s...") |
(No difference)
|
Latest revision as of 00:27, 8 May 2017
Quality control and data pre-processing
Contents
- 1 Contents
- 2 Data formats
- 3 Data formats
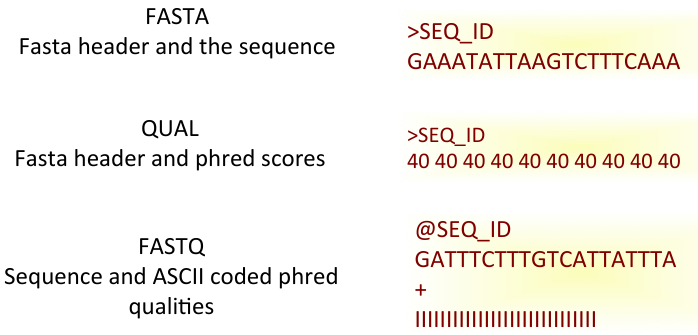
- 4 Sequence Data Format
- 5 GFF
- 6 GFF3 file example
- 7 GFF graphicalGFF
- 8 BED
- 9 Quality Control
- 10 Quality control tools
- 11 Quality control tools
- 12 Quality Control
- 13 Per base sequence quality
- 14 Addressing QC with FastQC
- 15 Addressing QC with FastQC
- 16 Per tile sequence quality 1
- 17 Per tile sequence quality 2
- 18 Per base sequence content
- 19 Per base GC content
- 20 Per sequence GC content
- 21 Per sequence N content
- 22 Sequence duplication levels
- 23 Overrepresented sequences and k-mer content
- 24 Sequence Filtering 1
- 25 Sequence Filtering 2
- 26 Sequence filtering tools
- 27 Next
Contents
- Data formats
- – Fasta and Fastq formats
- – Sequence quality encoding
- Quality Control (QC)
- – Evaluation of sequence quality
- – Quality control tools
- – Addressing QC with FastQC
- – Typical artifacts and sequence filtering
Data formats
- Text-based formats
- If not compressed, it can be huge
- Almost every programming language has a parser
Data formats
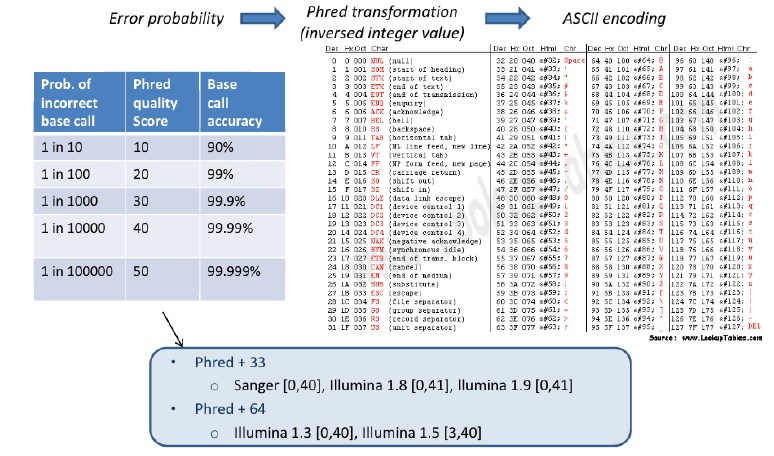
Fastq Format: Sequence quality encoding
Sequence Data Format
Raw sequence data format (Flat/Binary files)
- Fasta, Fastq, HDF5
- Others: http://en.wikipedia.org/wiki/List_of_file_formats#Biology
Processed sequence data format (Flat files)
- Column separated files containing genomic features
and their chromosomal coordinates.
- Different files
- GFF and GTF
- BED
GFF
- Column separated file format contains features located at chromosomal locations
- Not a compact format
- Several versions
– GFF 3 most currently used – GFF 2.5 is also called GTF (used at Ensembl for describing gene features)
GFF3 file example
##gff-version 3
##sequence-region ctg123 1 1497228
ctg123 . gene 1000 9000 . + . ID=gene00001;Name=EDEN
ctg123 . TF_binding_site 1000 1012 . + . Parent=gene00001
ctg123 . mRNA 1050 9000 . + . ID=mRNA00001;Parent=gene00001
ctg123 . mRNA 1050 9000 . + . ID=mRNA00002;Parent=gene00001
ctg123 . mRNA 1300 9000 . + . ID=mRNA00003;Parent=gene00001
ctg123 . exon 1300 1500 . + . Parent=mRNA00003
ctg123 . exon 1050 1500 . + . Parent=mRNA00001,mRNA00002
ctg123 . exon 3000 3902 . + . Parent=mRNA00001,mRNA00003
ctg123 . exon 5000 5500 . + . Parent=mRNA00001,mRNA00002,mRNA00003
ctg123 . exon 7000 9000 . + . Parent=mRNA00001,mRNA00002,mRNA00003
ctg123 . CDS 1201 1500 . + 0 ID=cds00001;Parent=mRNA00001
ctg123 . CDS 3000 3902 . + 0 ID=cds00001;Parent=mRNA00001
ctg123 . CDS 5000 5500 . + 0 ID=cds00001;Parent=mRNA00001
ctg123 . CDS 7000 7600 . + 0 ID=cds00001;Parent=mRNA00001
ctg123 . CDS 1201 1500 . + 0 ID=cds00002;Parent=mRNA00002
ctg123 . CDS 5000 5500 . + 0 ID=cds00002;Parent=mRNA00002
ctg123 . CDS 7000 7600 . + 0 ID=cds00002;Parent=mRNA00002
ctg123 . CDS 3301 3902 . + 0 ID=cds00003;Parent=mRNA00003
ctg123 . CDS 5000 5500 . + 2 ID=cds00003;Parent=mRNA00003
ctg123 . CDS 7000 7600 . + 2 ID=cds00003;Parent=mRNA00003
ctg123 . CDS 3391 3902 . + 0 ID=cds00004;Parent=mRNA00003
ctg123 . CDS 5000 5500 . + 2 ID=cds00004;Parent=mRNA00003
ctg123 . CDS 7000 7600 . + 2 ID=cds00004;Parent=mRNA00003
| Col1 | Col2 | Col3 | Col4 | Col5 | Col6 | Col7 | Col8 | Col9 |
| "seqid" | "source" | "type" | "start" | "end" | "score" | "strand" | "phase" | "attributes" |
GFF graphicalGFF
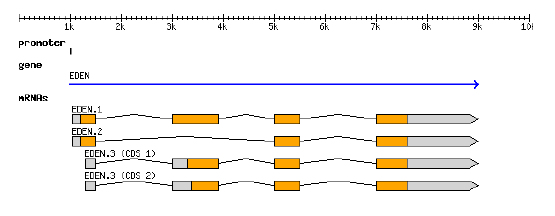
representation structure
GFF3 can describes the representation of a protein-coding gene (From Sascha Steinbiss' genomte-tools suite of programs: http://genometools.org/)
BED
- Created by UCSC Genome team
- Contains similar information to the GFF, but optimized for viewing in the UCSC genome browser
- - Essentially about features and ranges.
- BIG BED, optimized for next gen data – essentially a binary version
- – It can be displayed at UCSC Web browser (even several Gbs !!)
Quality Control
Evaluation of sequence quality
- Primary tool to assess sequencing
- Evaluating sequences in depth is a valuable approach to assess how reliable our results will be.
- QC determines posterior filtering
- - Any filtering decision will affect downstream analysis.
- QC must be run after every critical step.
Quality control tools
- Fastx-toolkit (http://hannonlab.cshl.edu/fastx_toolkit/index.html)
- NGS QC Toolkit (http://www.nipgr.res.in/ngsqctoolkit.html)
Quality control tools
Quality Control
- Addressing QC with FastQC
- - Basic stats
- - Per base sequence quality
- - Per read sequence quality
- - Per base sequence content
- - Per base GC content
- - Per sequence GC content
- - Per base N content
- - Sequence length distribution
- - Duplicate sequences
- - Overrepresented sequences
- - Overrepresented k-mers
Examples on web:
- - Good quality:
http://www.bioinformatics.babraham.ac.uk/projects/fastqc/good_sequence_short_fastqc.html
- - Bad quality:
http://www.bioinformatics.babraham.ac.uk/projects/fastqc/bad_sequence_fastqc.html
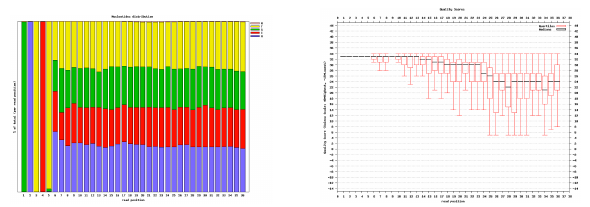
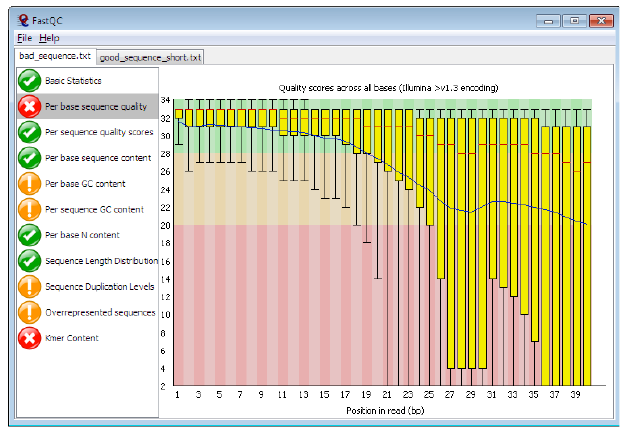
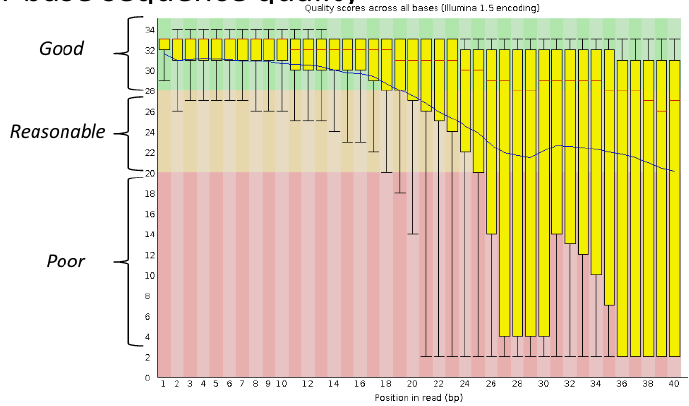
Per base sequence quality
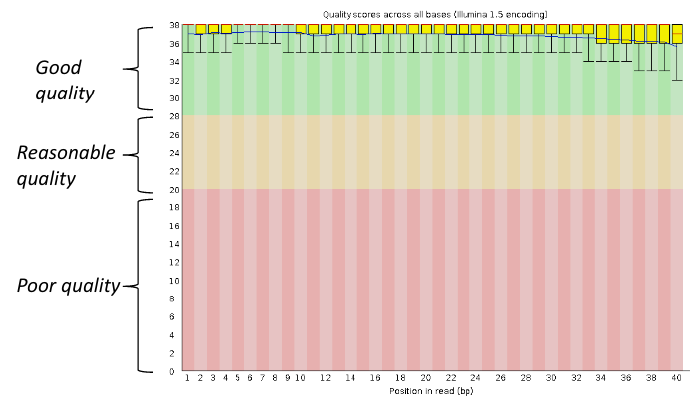 Good data = Consistent high quality along the read
Addressing QC with FastQC
Bad data = Quality decreases towards the end of the read and High variance
Addressing QC with FastQC
Per sequence quality scores
| Good data = most reads are high-quality sequences |
| Bad data = Distribution with bi-modalities |
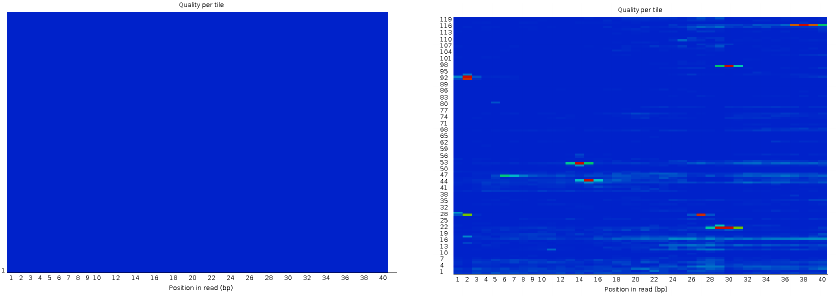
Per tile sequence quality 1
| Good data = Blue all over |
| Bad data = Presence of hot colours |
Per tile sequence quality 2
| Problems in some tiles |
| Filtering of reads with Q30 on 90% of the read |
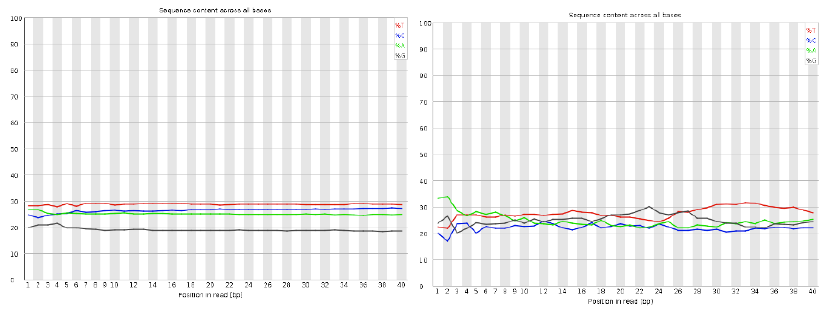
Per base sequence content
| Good data = smooth over the read |
| Bad data = Sequence position bias and adapter contamination |
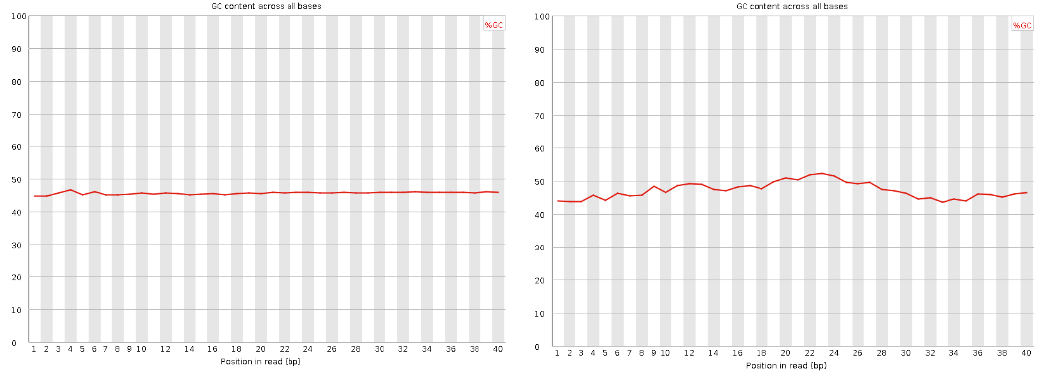
Per base GC content
| Good data = smooth over the read |
| Bad data = Sequence position bias and adapter contamination |
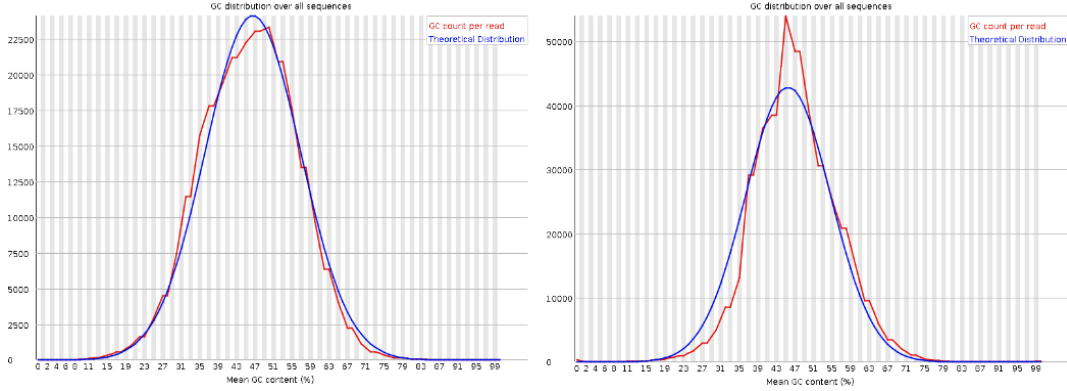
Per sequence GC content
| Good data = Normal distribution, Distribution fits with expected, Organism dependent |
| Bad data = Distribution doesn’t fit with expected. Possibility of contamination |
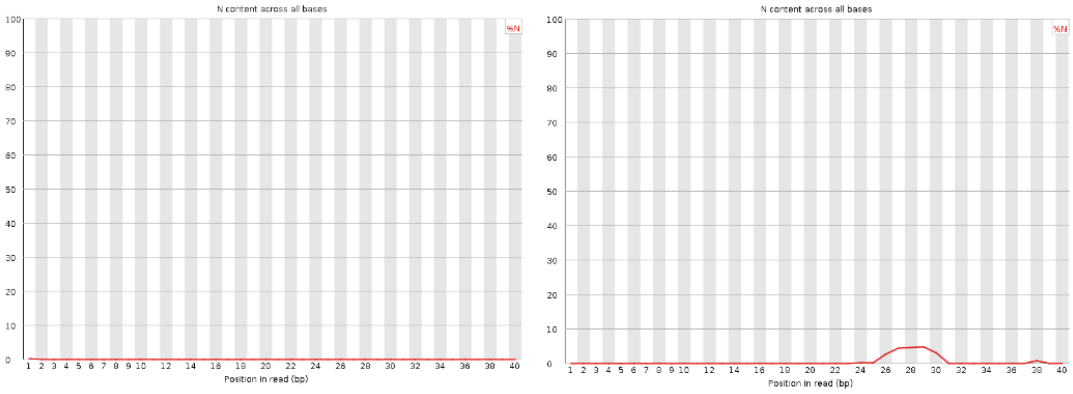
Per sequence N content
| Good data |
| Bad data = There are peaks of Ns per base position. |
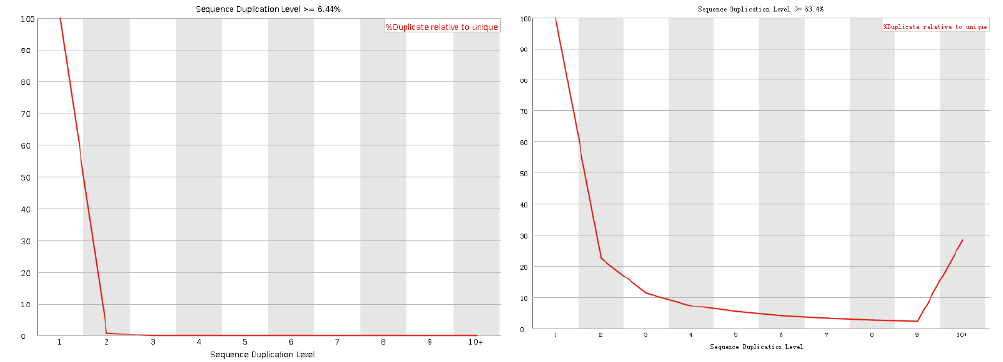
Sequence duplication levels
| Good data |
| Bad data = High number of duplicates. Indicates some kind of enrichment bias. |
- Note:
- - Only few sequences are used to make this judgment.
- - For RNASeq, higher number of duplicated sequences are expected.
Overrepresented sequences and k-mer content
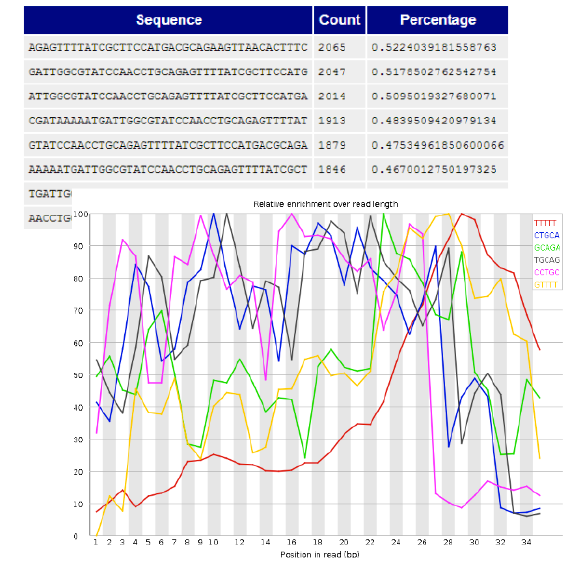
- Exact same sequences too many times
- PCR primers, Adapters, etc.
- Note:
- - Sometimes this is expected
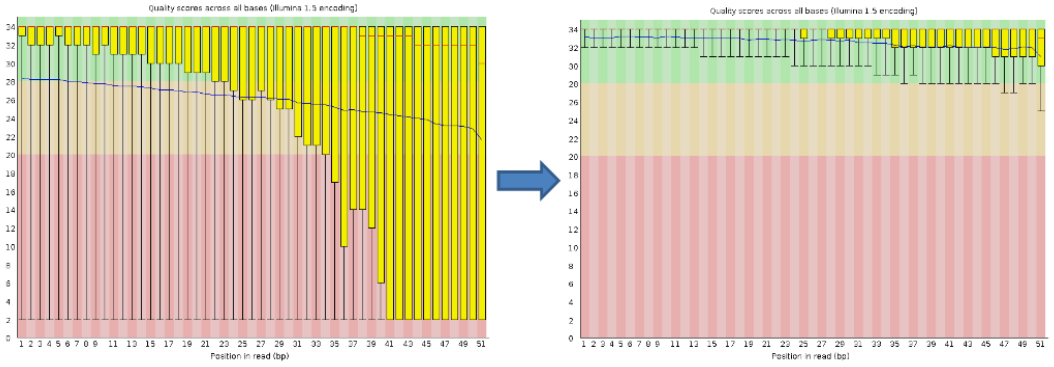
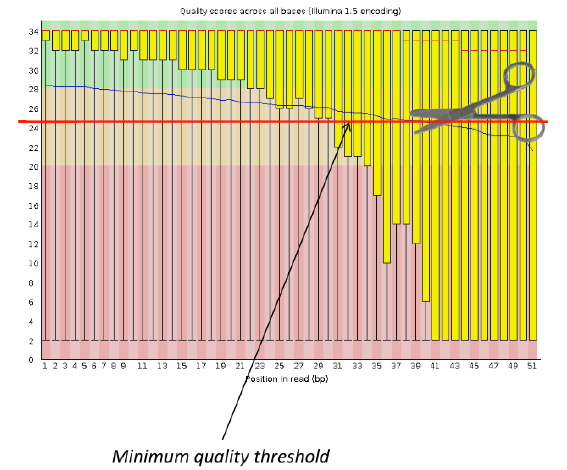
Sequence Filtering 1
- It is important to remove bad quality data as our confidence on downstream analysis will be improved.
Sequence Filtering 2
- Mean quality
- Read length after trimming
- Percentage of bases above a quality threshold
- Adapter trimming
Sequence filtering tools
- Fastq-mcf
- Cutadapt
- SeqTK
- Trimmomatic
Next
Practical sequence filtering session
