Difference between revisions of "Visualisation of mapped reads"
| Line 6: | Line 6: | ||
In this part you will learn to: | In this part you will learn to: | ||
* Use a genome browser, the Broad Institute's IGV, to visualise mapped reads | * Use a genome browser, the Broad Institute's IGV, to visualise mapped reads | ||
| + | |||
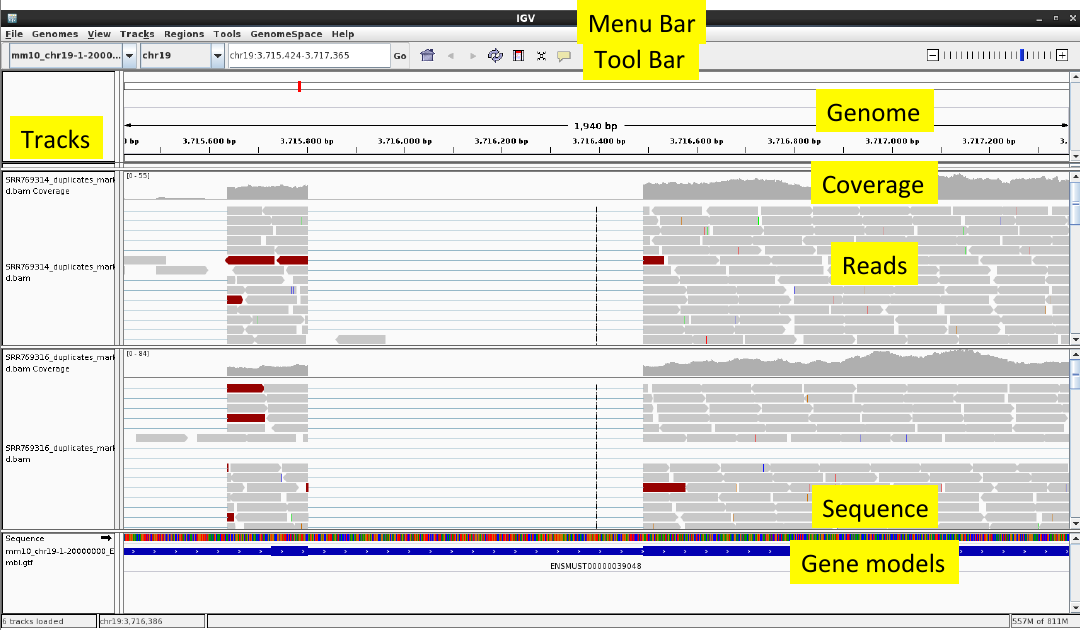
| + | [[File:igvlayout.png]] | ||
= Software to be used = | = Software to be used = | ||
| Line 23: | Line 25: | ||
* <code>mm10_chr19-1-20000000_Ensembl.gtf</code>: Ensembl mouse gene models | * <code>mm10_chr19-1-20000000_Ensembl.gtf</code>: Ensembl mouse gene models | ||
| − | Data | + | = Data location = |
| − | The data is available in the directory 04_Visualisation_of_mapped_reads | + | The data is available in the directory <code>04_Visualisation_of_mapped_reads</code>, i.e. |
cd ~/i2rda_data/04_Visualisation_of_mapped_reads | cd ~/i2rda_data/04_Visualisation_of_mapped_reads | ||
Revision as of 10:11, 9 May 2017
Contents
Introduction
In contrast to the other more quantitative stages, this exercise is qualitative in the sense that we get a visual feel for a certain area of interest.
Aims
In this part you will learn to:
- Use a genome browser, the Broad Institute's IGV, to visualise mapped reads
Software to be used
- samtools v0.1.19: http://samtools.sourceforge.net/
- Integrated Genomics Viewer (IGV) 2.3.92: http://www.broadinstitute.org/igv/
To load these up:
module load samtools IGV
We'll be using the same data as before, but this time we will have two alignment files (i.e. two samples) from the same study. They are samples SRR769314 and SRR769316. The are tailored with respect to the time allocated for the workshop. They were aligned to the first 20 Mb of chromosome 19 of the mouse reference genome (GRCm38/mm10) using TopHat and duplicates have already been marked using Picard MarkDuplicates.
We shall will use the following files:
-
SRR769314_duplicates_marked.bam: aligned reads (without and with using gene annotation) -
SRR769316_duplicates_marked.bam: aligned reads (without and with using gene annotation) -
mm10_chr19-1-20000000.fasta: mouse reference genome sequence -
mm10_chr19-1-20000000_Ensembl.gtf: Ensembl mouse gene models
Data location
The data is available in the directory 04_Visualisation_of_mapped_reads, i.e.
cd ~/i2rda_data/04_Visualisation_of_mapped_reads
Indexing BAM files
To enable fast access to any part of the BAM files we need to create an index using samtools:
samtools index SRR769314_duplicates_marked.bam
samtools index SRR769316_duplicates_marked.bam
Starting and using IGV
igv.sh &
To load the mouse genome
Select Genomes -> Load Genome from File...
Navigate to <yourhomedirectory> -> i2rda_data -> 06_Visualisation_of_mapped_reads -> Reference
Select the mm10_chr19-1-20000000.fasta file
Click [Open]
To load the alignments
Select File -> Load from File...
Navigate to <yourhomedirectory> -> i2rda_data -> 06_Visualisation_of_mapped_reads
Select both the SRR769314_duplicates_marked.bam and SRR769316_duplicates_marked.bam files by Ctrl+Click
Click [Open]
To load the Ensembl gene models
Select File -> Load from File...
Navigate to <yourhomedirectory> -> i2rda_data -> 06_Visualisation_of_mapped_reads -> Reference
Select the mm10_chr19-1-20000000_Ensembl.gtf file
Click [Open]
Zoom into target areas
Zoom in until you start seeing reads.
1. Navigate to chr19:3715000-3718000. Copy-paste for best accuracy. Note that IGV adds thousand separators to your location afterwards.
2. Navigate to chr19:5748800-5751100. Zoom in to observe each end of this exon-exon junction.
Question:
- What do you think of the alignment? How would you fix it?
Add the reads aligned using gene annotation data:
Select File -> Load from File...
Navigate to home -> training -> Data/ -> 06_Visualisation_of_mapped_reads -> with_gtf
Select the SRR769314_duplicates_marked.bam and SRR769316_duplicates_marked.bam files
Click [Open]
3. Navigate to chr19:5748800-5751100. Verify that the alignment looks better.
Question:
- How accurate do you think TopHat would be to detect novel (unannotated) junctions?
4. Navigate to chr19:4709000-4756000. Right click on the track names and select Collapsed.
Question:
- What do you think of the difference in coverage between the SRR769314 and SRR769316 samples?
5. Navigate to chr19:6982100-6987800. Right click on the track names and select Sashimi Plot.
Question:
- Can you identify which isoform is more expressed in each sample?
